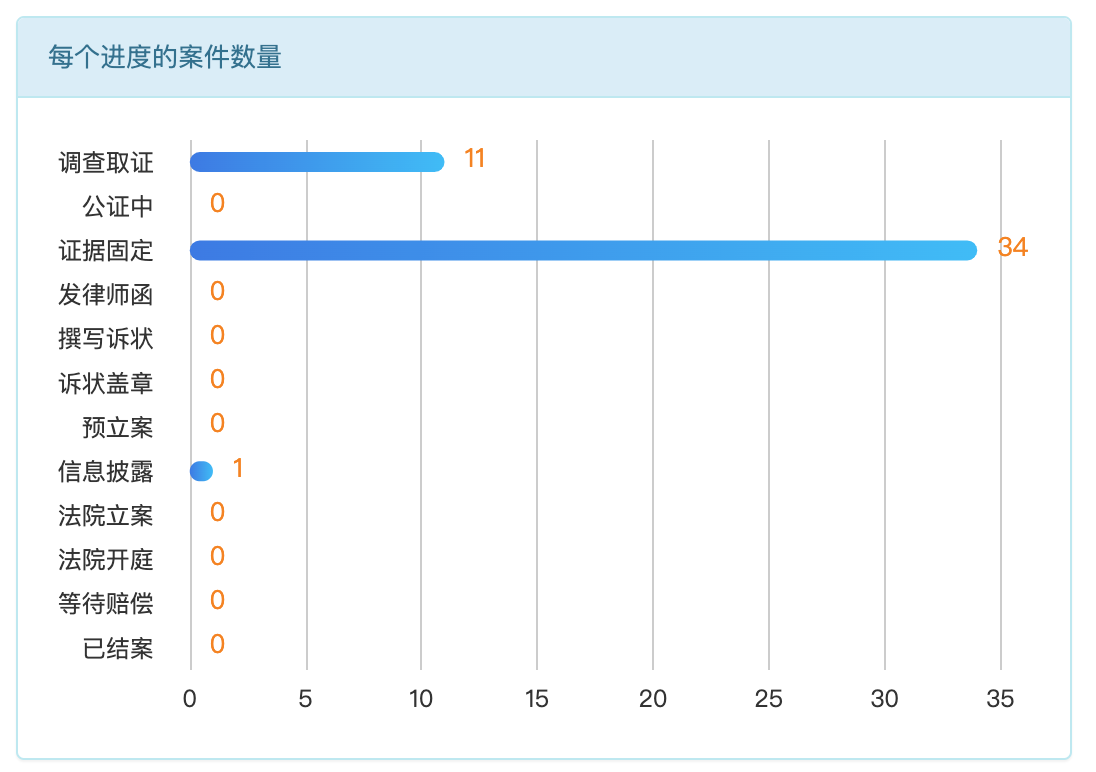
echarts 一个横向柱状图表实例收藏
作者:钓赛通
发布时间:2021-12-03
点击数:
效果如图:
1.先在页面中引入js
<script src="{{asset('assets/js/echarts.min.js')}}"></script>2.插入js代码
var category = ['调查取证', '公证中', '证据固定', '发律师函', '撰写诉状', '诉状盖章', '信息披露', '预立案', '法院立案', '法院开庭', '等待赔偿', '已结案'];
var barData = []; //这里存放数据
var option33 = {
    tooltip: {
        trigger: 'axis',
        axisPointer: {
            type: 'shadow'
        }
    },
    grid: {
        top: '2%',
        left: '3%',
        right: '4%',
        bottom: '3%',
        containLabel: true
    },
    xAxis: {
        type: 'value',
        axisLine: {
            show: false
        },
        axisTick: {
            show: false
        }
    },
    yAxis: {
        type: 'category',
        data: category,
        splitLine: {show: false},
        axisLine: {
            show: false
        },
        axisTick: {
            show: false
        },
        offset: 10,
        nameTextStyle: {
            fontSize: 15
        }
    },
    series: [
        {
            name: '数量1',
            type: 'bar',
            data: barData,
            barWidth: 10,
            //barGap: -300,
            //barCategoryGap:-300,
            smooth: true,
            label: {
                normal: {
                    show: true,
                    position: 'right',
                    offset: [5, -2],
                    textStyle: {
                        color: '#F68300',
                        fontSize: 13
                    }
                }
            },
            itemStyle: {
                emphasis: {
                    barBorderRadius: 7
                },
                normal: {
                    barBorderRadius: 7,
                    color: new echarts.graphic.LinearGradient(
                        0, 0, 1, 0,
                        [
                            {offset: 0, color: '#3977E6'},
                            {offset: 1, color: '#37BBF8'}

                        ]
                    )
                }
            }
        }
    ]
};
var myChart33 = echarts.init(document.getElementById('case_status_num_datav'));
myChart33.setOption(option33);
3.在页面内容中建立一个ID : '
case_status_num_datav
的div。
刷新一下页面,效果就出来了。
至于 data 数据,你就可以通过ajax 从后端拿取。
